Engines¶
Our framework offers two engines. Based on the same definition and the same tool’s repository, a pipeline can be put to run either on the workstation or on a compatible cloud environment. Both engines analyse the pipeline description and transformation it to an executable format, determining resource requirements of each tool based on the tool configuration present in the repository.
Engine for workstation¶
The NGSPipes engine for workstation starts with a pipeline description and transform it into a sequence of calls to the designated tools. After this, the engine automatically configures and executes each tool in isolation from the remaining system environment (using a dedicated virtual machine).
The NGSPipes engine for workstation is available in two flavors: a command line user interface (CUI) and a graphic user interface (GUI). The first is ideal to use when running on remote servers (either physical or deployed as virtual machines in the cloud), although it can also run locally. The second one can be used in systems where a graphical display is available.
The following sections shows how to run the engine. To build from source code please follow the instructions in subsection “Instructions to build NGS Pipes Engine from source code”.
Requirements to run the engine for workstation¶
The machine where engine is to be executed needs the following tools:
- Java 8 Development Kit (http://www.oracle.com/technetwork/java/javase/downloads/jdk8-downloads-2133151.html).
- VirtualBox version >= 5.0 (https://www.virtualbox.org/wiki/Downloads). NOTE: Ensure the command
VBoxManagecan be found by the command line of your operating system.
Install engine for workstation¶
The engine is made of a regular Java application and a VirtualBox’s compliant image (also identified as executor). To deploy this in your system:
- Download engine-2.0-zip from our file server and uncompress to a working directory (
WD) - Download the executor image from here and uncompress to your work directory (
WD\engine-1.0\) - Follow the instructions bellow to either run in a system in a console or with a graphical interface.
After these steps you should have the following file tree:
  WD
    |-- engine-1.0\
       |-- NGSPipesEngineExecutor\
          |-- NGSPipesEngineExecutor.vbox
          |-- NGSPipesEngineExecutor.vdi
       |-- bin\
          |-- engine        (CUI OSX/Linux run script)
          |-- engine.bat    (CUI Window run script)
          |-- engine-ui     (GUI OSX/Linux run script)
          |-- engine-ui.bat (GUI Window run script)
       |-- lib\
          |-- ...
    |-- (other files, e.g. the pipeline description)
Run the Engine for workstation¶
The engine is provided as a console application or a graphical user interface application.
command line tool¶
This is a regular Java application packed as a JAR file. To run, use the following command line at the working directory (WD):
Windows:¶
c:\WD>engine-1.0\bin\engine.bat <mandatory arguments> [<optional arguments>]
OSX/Linux¶
user@machine:/home/WD$ engine-1.0/bin/engine <mandatory arguments> [<optional arguments>]
Parameters¶
- The command line tool has the following mandatory parameters :
-pipes
-in
-out
- The command line tool has the following optional parameters :
-cpus
-mem
-from
-to
-executor
Example¶
A small example with only manadatory arguments (a more complete description is presented in the subsection “Use case”.
engine-1.0/bin/engine -in /home/ngs/inputs -out /home/ngs/outputs -pipes pipeline.pipes
Error reporting¶
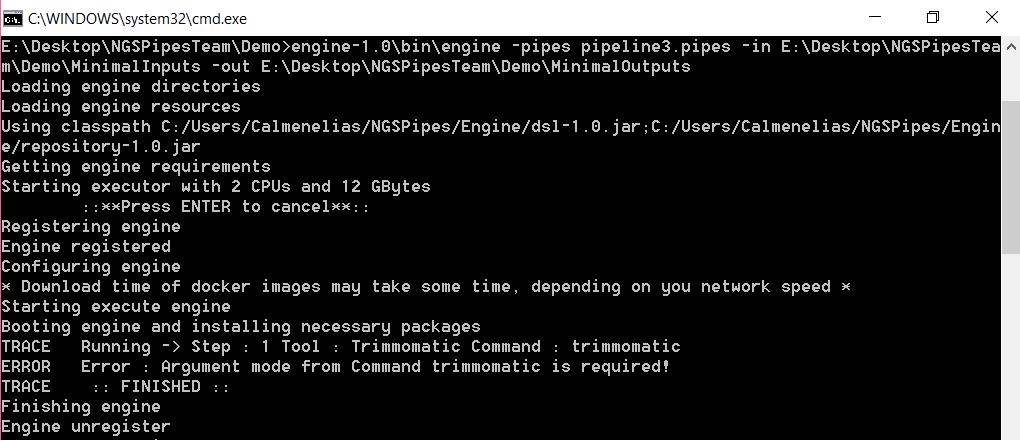
The next figure shows an error report from the pipeline engine when executing a pipeline where a mandatory argument is not specified.
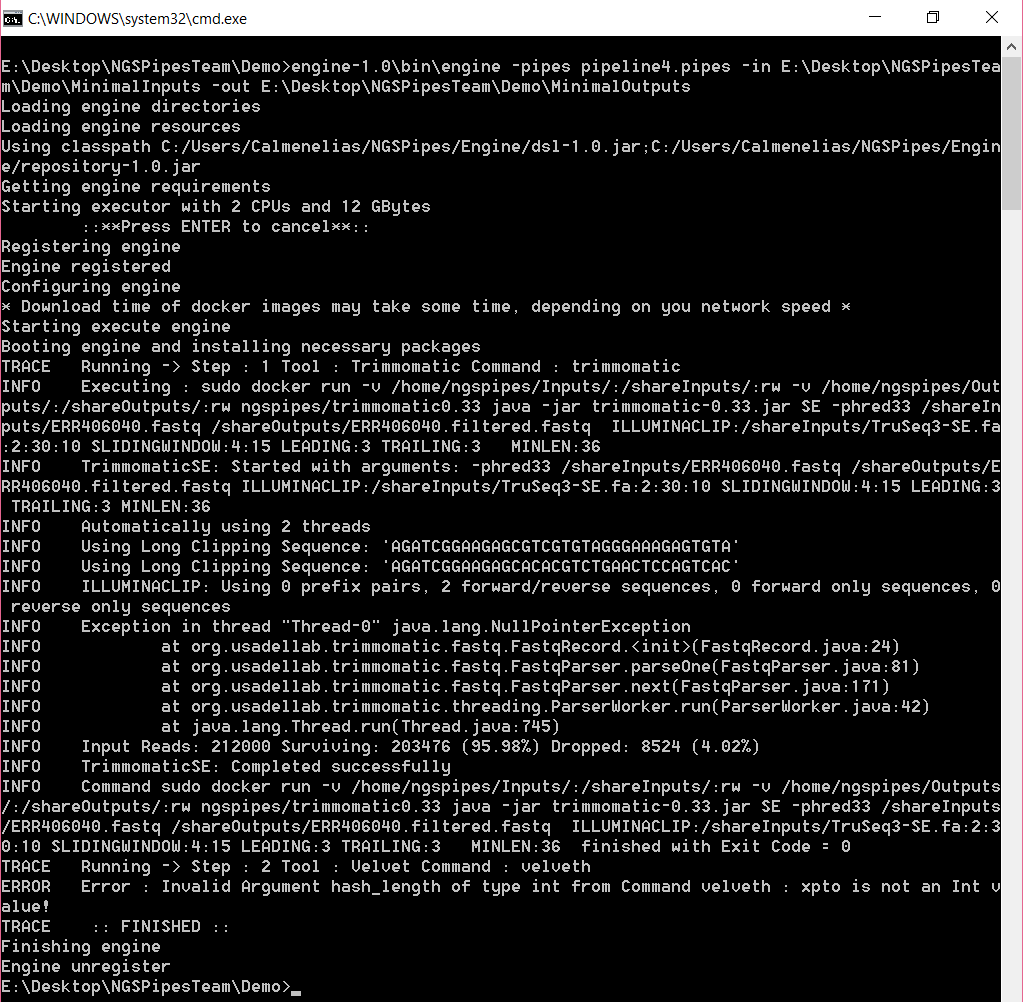
The next figure shows an error report from the pipeline engine when executing a pipeline where an argument is uses with a non-compatible value type, according to the tool’s specification.
User interface tool¶
The GUI version of the NGSPipes Engine for workstation allows the same operations but using a graphical interface. When installed at a working directory (WD), the tool can be executed in the file explorer of your operating system:
Windows¶
WD\engine-1.0\bin\engine-ui.bat
OSX/Linux¶
WD/engine-1.0/bin/engine-ui
If you have OSX and you you prefer the double click version to run the editor, it may appears, only the first time after you double click it, the following info:
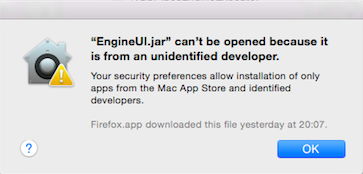
Figure 1
Then, go to “System Preferences” and choose “Security and Privacy”
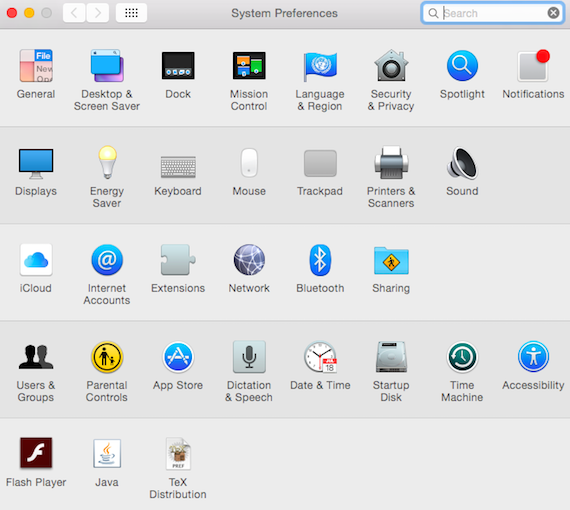
Figure 2
Then select the button “Open anyway”
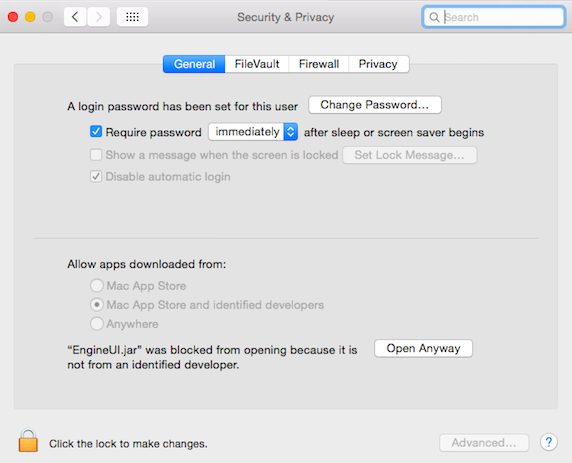
Figure 3
Notice that depending on the MAC OS version, it may be necessary to unlock to make changes and to select the option “Allow apps downloaded from Anywhere
Screen shots¶
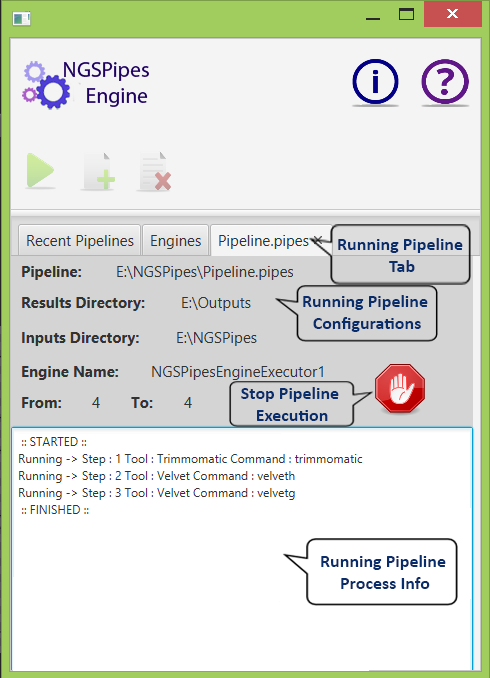
The following image shows a screenshot of the main windows and a short description of each button.
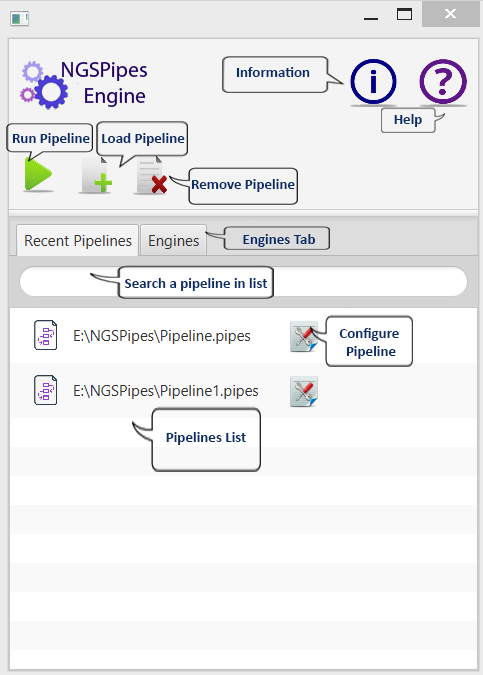
There are two main tabs: Recent pipelines and Engines. The Recent pipelines tab lists the last pipelines loaded by the application. It also allows the configuration of parameters for a selected pipeline. The Engines tab shows the previously used instances. In each engine, different tools can already be installed. The user can choose which instance to execute based on his knowledge of the pipeline.
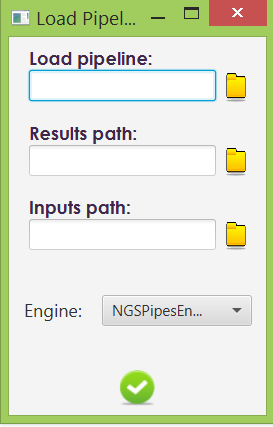
Load pipeline¶
When loading a pipeline the user chooses the file with the pipeline description, the directory at the user’s computer where the results are to be written and the path from where the data is to be loaded. The user can also choose which engine instance to use.
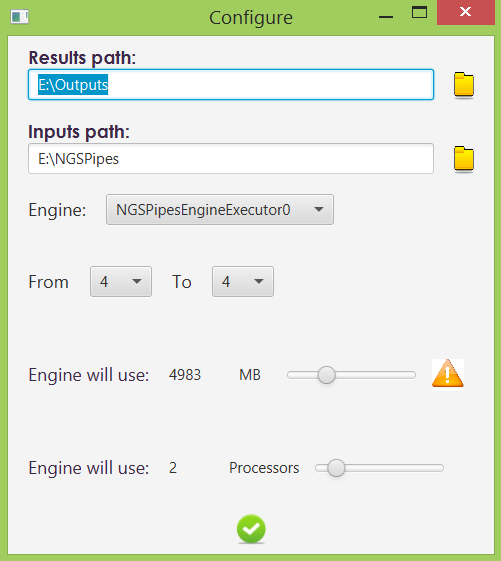
Configure pipeline¶
When a pipeline description in already loaded by the UI, several execution parameters can be changed: paths, engine instance, memory and number of cores.
Execute pipeline¶
When an engine instance is selected and the “Run Pipeline” button is pressed, the UI will show the following window, where output information regarding the execution steps are presented.
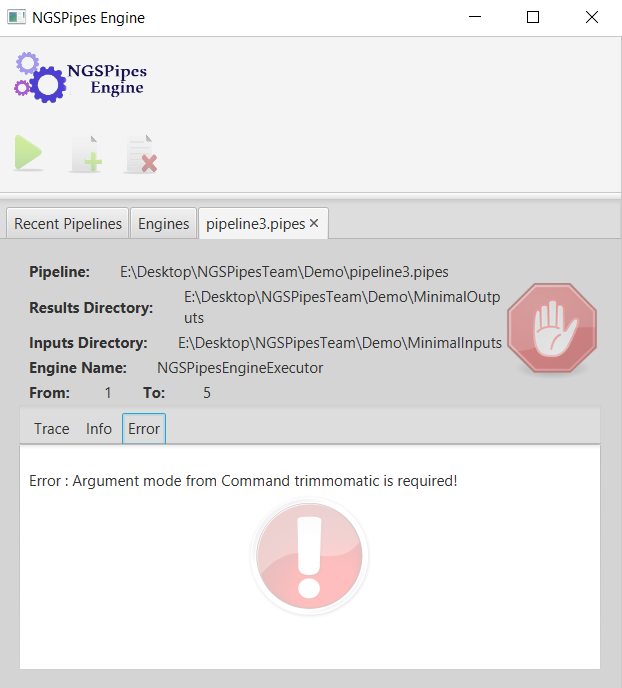
Error reporting¶
Errors can occur during the execution of a pipeline. For example, the next figure shows an error related to a mandatory argument that is not specified.
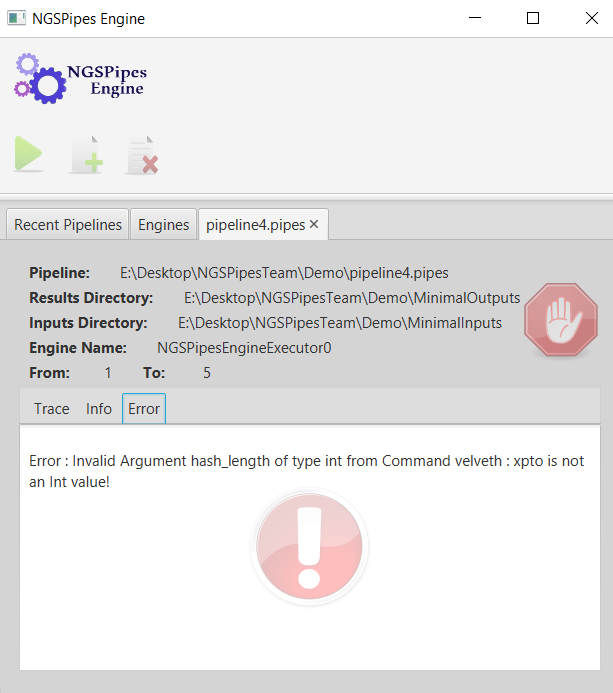
The next figure shows an error related to a mismatch between the type of value used in the pipline and the type of parameter that is present in the specification of the tool.
Use case¶
The following use case executes the pipeline described in the DSL section using the console version of NGSEngine. The tools’ repository used in the pipeline is https://github.com/ngspipes/repository. It has metadata for the tools Trimmomatic, Velvet and Blast.
- Check if requirements are met and that the engine and executor image are installed.
- Download the pipeline here and save it as
pipeline.pipesto the working directory. The following examples assume the working directory isc:\ngspipes. - Download the input data sample and place it at
inputsdirectory (other name can be chosen). This data set comes from the NCBI SRA, being part of a project on deep sequencing within the Streptococcus pneumoniae antibiotic resistant pandemic clone PMEN1. Extra information on how this data was obtained can be obtained here.
After unziping file ERR406040.fastq.zip the directory content will look like:
c:\ngspipes\inputs
   |-- allrefs.fna.pro
   |-- ERR406040.fastq
   |-- NexteraPE-PE.fa
   |-- TruSeq2-PE.fa
   |-- TruSeq2-SE.fa
   |-- TruSeq3-SE.fa
   |-- TruSeq3-PE-2.fa
   |-- TruSeq3-PE.fa
   |-- TruSeq3-SE.fa
- Create the
outputsdirectory (c:\ngspipes\outputs) - Execute the engine at your working directory using the following command line:
Windows¶
c:\ngspipes>engine-1.0\bin\engine.bat -in c:\ngspipes\inputs -out c:\ngspipes\outputs -pipes c:\ngspipes\pipeline.pipes
OSX/Linux¶
ngs@server:/home/ngspipes$engine-1.0/bin/engine -in /home/ngspipes/inputs -out /home/ngspipes/outputs -pipes /home/ngspipes/pipeline.pipes
Example and description of output messages¶
Initial steps of the output will look like this:
Loading engine directories
Loading engine resources
Using classpath C:/Users/user/NGSPipes/Engine/dsl-1.0.jar;
               C:/Users/user/NGSPipes/Engine/repository-1.0.jar
Getting engine requirements
Getting clone engine
Clonning engine
...... Clonning engine
...... Clonning engine
...... Clonning engine
...... Clonning engine
...... Clonning engine
...... Clonning engine
Configurating engine
Starting execute engine
Booting engine and installing necessary packages
...
Note that the cloning step only happens in the first execution of the engine. On the other hand, when a tool is used for the first in any pipeline, the engine will automatically download and install the corresponding Docker image. An example of output for when this is necessary is presented for the Trimmomatic tool:
...
TRACE    :: STARTED ::
TRACE   Running -> Step : 1 Tool : Trimmomatic Command : trimmomatic
INFO    Executing : sudo docker run -v /home/ngspipes/Inputs/:/shareInputs/:rw -v
                            /home/ngspipes/Outputs/:/shareOutputs/:rw
                        ngspipes/trimmomatic0.33 java -jar trimmomatic-0.33.jar SE
                        -phred33 /shareInputs/ERR406040.fastq /shareOutputs
                        ERR406040.filtered.fastq
                        ILLUMINACLIP:/shareInputs/adapters/TruSeq3-SE.fa:2:30:10
                        SLIDINGWINDOW:4:15 LEADING:3 TRAILING:3   MINLEN:36
INFO    Unable to find image 'ngspipes/trimmomatic0.33:latest' locally
INFO    latest: Pulling from ngspipes/trimmomatic0.33
INFO    511136ea3c5a: Pulling fs layer
INFO    e977d53b9210: Pulling fs layer
INFO    c9fa20ecce88: Pulling fs layer
...
INFO    6cf3f4911f80: Download complete
INFO    Digest: sha256:44f1dea760903cdce1d75c4c9b2bd37803be2e0fbbb9e960cd8ff27048cbb997
INFO    Status: Downloaded newer image for ngspipes/trimmomatic0.33:latest
INFO    TrimmomaticSE: Started with arguments: -phred33 /shareInputs/ERR406040.fastq
                            / shareOutputs/ERR406040.filtered.fastq
                            ILLUMINACLIP:/shareInputs/adapters/TruSeq3-SE.fa:2:30:10
                            SLIDINGWINDOW:4:15 LEADING:3 TRAILING:3 MINLEN:36
...
Note that this tool was previously dockerized by the NGSPipes team. For other tools, such as Velvet or Blast, there is already public Docker images which the example pipeline uses.
When the execution finish, the following files will be at the working directory:
c:\ngspipes\outputs
   |-- allrefs.phr
   |-- allrefs.pin
   |-- allrefs.psq
   |-- blast.out
   |-- filtered.fastq
   |-- velvetdir/
      |-- Log
      |-- Roadmaps
      |-- Sequences
      |-- contigs.fa
      |-- LastGrpah
      |-- stats.txt
Execution times¶
The above example was executed using several hardware configurations and operating systems. The pipeline was executed with the command line:
ngs@server:/home/ngspipes$engine-1.0/bin/engine -in /home/ngspipes/inputs
                          -out /home/ngspipes/outputs -pipes /home/ngspipes/pipeline.pipes
The folowing table shows execution times measured on cold and warm start situations. Cold start happens when the engine is executed the first time after installation. Warm start represents the situation when a pipeline is being re-executed and no updates are necessary to the tools.
| OS | CPU | RAM (GB) | Disk | Cold start | Warm start | |————-|———————|———-|——|————|————| | Windows 10 | Intel i5 @ 2.53 Ghz | 8 | SSD | 39 min. | 35 min. | | Windows 10 | Intel i7 @ 3.5 Ghz | 16 | HDD | 39 min. | 30 min. | | OSX | Intel(TM) i5 1.8Ghz | 8 | SSD | 41 min. | 38 min. |
As expected, a cold start takes an extra time because of intial setup and download of the tools used in the pipeline. Warm start is the common execution scenario. These values can vary depending on:
- the size of the input data;
- the number of tools and commands used in pipeline;
- the input data and resources assigned to the execution image (CPU (
-cpus) and memory (-mem)).
Instructions to build NGS Pipes Engine for workstation from source code¶
Requirements¶
No specific tools must be installed to build the NGSPipes engine for workstation. The code is available at git hub repository, which can be downloaded as a zip.
The source code repository can also be cloned. In the last case, the git version control tool must be installed first.
Build commands¶
To build the NGSPipes engine for workstation follow these steps:
- Download the zip or clone the git repo to your working directory. The following command will build all the components – DSL, Tools repository and the Engine (both console and UI version).
cd maingit submodule initgit submodule updategradlew build(This will install Gradle, if necessary)
- To generate the
engine-1.0.zipandeditor-1.0.zipdistributions files, rungradlew distZip, atmaindirectory. The files will be located at the respectivebuild/distributionsdirectory.
Engine for cloud¶
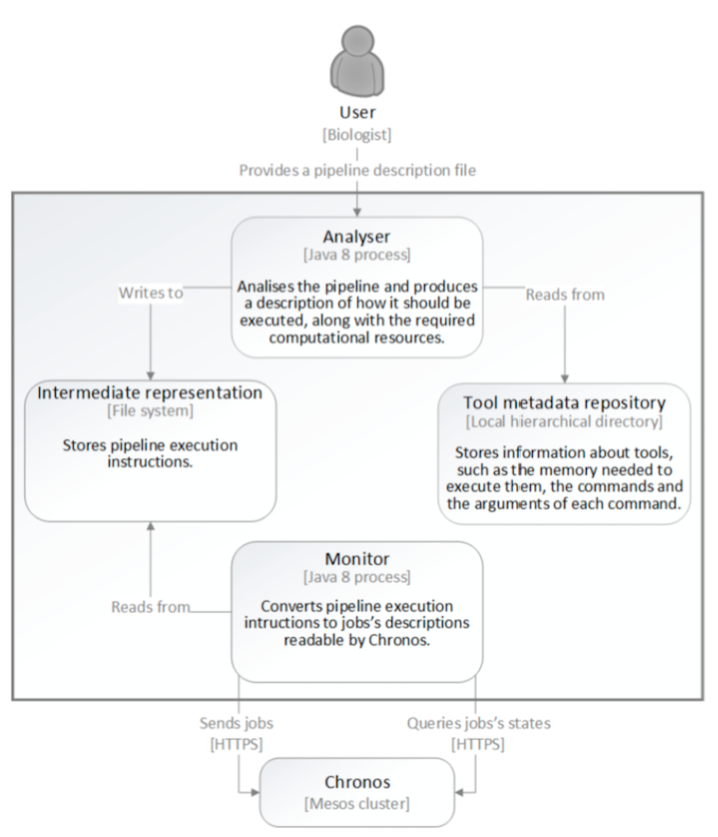
The Engine for cloud solution consists of two tools: the analyser and the monitor.
The analyser inspects the given pipeline and, using the information stored in the tool meta-data repository, produces the instructions to execute the pipeline, along with the required computational resources for its execution. These tool produces internally a graph of tasks, which reflects the dependency among the tasks and allows to infer what can be executed in parallel an what can only be executed in serie. These instructions are then written to a file and locally stored, giving origin to an intermediate representation. The analyser tool can be simple executed in a workstation or in a cloud environment.
Given the pipeline representation produced by the Analyser tool, the monitor can be launched. The monitor tool is suitable for running in a cloud environment. It converts the intermediate representation into jobs’ descriptions readable by Chronos and, using Chronos’s REST API, schedules them for execution. The tasks are deployed in a cluster of machines governed by the Mesos batch job scheduling framework Chronos Having launched the pipeline, the user can now query the system to know its current state. This results in a series of requests from the monitor to Chronos. When the pipeline finishes the execution, the user can make a request to the monitor to download its outputs.
We provide a jar file with the analyser tool and a virtual machine with the monitor tool for experimental purposes, where users can simulate a cluster. With this machine, pipelines can be tested without requiring a big amount of computational ressources or an account in a cloud provider. Thus our solution can be tested in this virtual machine or within a cloud provider, as described in the subsection “Install engine for cloud”.
Next figure describes the main components of this engine and their interactions. More details on this engine can be found in this report.
Requirements to run the engine for cloud¶
To run the analyser tool you will need:
- to have installed JRE 8.
To run the monitor (within the virtual machine that we supply for testing) you will need:
- to have installed JRE 8.
- virtualization software which supports vmdk files, like VMware or VirtualBox.
- To emulate the image is required 8GB of RAM and 1 CPU
To run the monitor (without the virtual machine that we supply for testing) you will need:
- a cluster with Chronos installed with the following requirements:
- an endpoint to Chronos REST API;
- Support for the execution od Docker jobs on all Mesos-Agents (Slaves);
- A NFS acessible on all Mesos-Agents
- SSH acess to a cluster machine that can interact with the cluster’s NFS;
Install the engine for cloud¶
Install the analyser¶
To deploy this in your system:
- Create a new directory named Analyser and download the executable to there.
- After the installlation, you should have the following tree file:
  WorkingDirectory
    |-- Analyser\
       |-- ngs4cloud-analyser-1.0-SNAPSHOT\
          |-- bin
              |--ngs4cloud-analyser
              |--ngs4cloud-analyser.bat (CUI Window run script)
    |-- Monitor\
       |-- monitor.jar
    |-- (other files,...)
Install the monitor¶
- To deploy this in your system:
- Create a new directory named Monitor and download the jar to there.
Normally to execute monitor.jar one would need a cluster with the specifications mentioned above. However to facilitate executing, for testing purposes, we provide a Virtual Image which emulates an appropriate cluster to execute monitor.jar. In a cloud environment, the setting will be similar, with the corresponding credentials.
- Emulate the image of the cluster using a virtualization software which supports vmdk files, like VMware or VirtualBox. To emulate the image is required 8GB of RAM and 1 CPU.
- In order to emulate the image (steps in Virtual Box), for instance, we should:
- Select the option
New Virtual Machine. We can choose, for instance, Debian. - Select the option
Using an existing virtual hard disk file. - Select the option
Create(for creating a virtual machine). - After creating, it is necessary to configure SSH between The host system and virtual box guest.
- Then, add a
NAT Networkin Virtual Box menu, namely,Virtual Box --> Preferences. - Then, add
vboxnext0in Virtual Box menu, namely,Virtual Box --> Preferences. - Then, select the created virtual machine and select this settings. In its settings:
- Check if the
IO APICis enabled, namely inSettings-->System; - Select to attach to
HostOnlyAdapterthe namevboxnet0, namely inSettings-->Adapter 2 - Select to attach
NAT Networkthe nameNAT Network, namely inSettings-->Adapter 1
- Check if the
- Select the option
- Launch (
Start) the created virtual machine. - After launching the virtual machine, wait for the graphical environment and log in the desktop using the following credentials:
User: ngs4cloud
Pass: cloud123
- Open a terminal and type the command
/sbin/ifconfig
and get the ip of Virtual Machine.
- If necessary, you may have to configure the ip of the Virtual Machine. For example
sudo ifconfig eth1 1§92.168.56.2 - Now back to the host OS. If you try to execute the monitor the following message will be shown +
"The environment variable NGS4_CLOUD_MONITOR_CONFIGS
needs to be defined with the path of the configuration file"
- Therefore we need to first setup the configurations so that we can execute the monitor.
In same directory where monitor.jar is, create a file named
configsand open it. Now write on the file the following configurations:
    SSH_HOST = "The ip of the virtual machine"
    SSH_PORT = 22
    SSH_USER = ngs4cloud
    SSH_PASS = cloud123
    CHRONOS_HOST = "The ip of the virtual machine"
    CHRONOS_PORT = 4400
    PIPELINE_OWNER = example@example.com
    CLUSTER_SHARED_DIR_PATH = /home/ngs4cloud/pipes
    WGET_DOCKER_IMAGE = jnforja/wget
    P7ZIP_DOCKER_IMAGE = jnforja/7zip
- An example of the
configs.txtis
SSH_HOST = 192.168.56.2
SSH_PORT = 22
SSH_USER = ngs4cloud
SSH_PASS = cloud123
CHRONOS_HOST = 192.168.56.2
CHRONOS_PORT = 4400
PIPELINE_OWNER = example@example.com
CLUSTER_SHARED_DIR_PATH = /home/ngs4cloud/pipes
WGET_DOCKER_IMAGE = jnforja/wget
P7ZIP_DOCKER_IMAGE = jnforja/7zip
- After defining the
config.txtfile, it is necessary to set the environment variable. - For instance, in MAC OS, for setting the environment variable is to open a terminal in the current
Monitor directory and then do
export NGS4_CLOUD_MONITOR_CONFIGS=configs.txtifconfig.txtis also in the Monitor directory. - In the monitor directory create another directory called
repoand add the following entry to the configs file:
EXECUTION_TRACKER_REPO_PATH = "The repo directory path"
- As an example,
configsfile should look like:
SSH_HOST = 192.168.56.2
SSH_PORT = 22
SSH_USER = ngs4cloud
SSH_PASS = cloud123
CHRONOS_HOST = 192.168.56.2
CHRONOS_PORT = 4400
PIPELINE_OWNER = example@example.com
CLUSTER_SHARED_DIR_PATH = /home/ngs4cloud/pipes
WGET_DOCKER_IMAGE = jnforja/wget
P7ZIP_DOCKER_IMAGE = jnforja/7zip
EXECUTION_TRACKER_REPO_PATH = /Users/cvaz/Documents/pipelines/Monitor/repo
Save the configs file and close it.
Now to finish configuring the monitor just add a environment variable named NGS4_CLOUD_MONITOR_CONFIGS with the path of the configs file as value.
Open a terminal and execute monitor.jar, a message explaining all the commands the monitor can execute should appear.
Run the Engine for cloud¶
Run the Analyser¶
This a regular Java application package as a JAR file. To run, open a terminal and execute the command analyse at the working directory.
user@machine:/home/workingDirectory$  ./bin/ngs4cloud-analyser analyse
 analyse <mandatory arguments>
Parameters
The command line tool has the following mandatory parameters:
-pipesRelative ou absolute path of the pipeline description (mandatory). This file must be a.pipesextension file, where the pipeline is written using the NGSPipes language.-irIntermediate representation file produced by the analyser. This filepath should be provided by the user.- This file will be given as input to the monitor tool.
-inputThe URI with the location of the inputs for the pipeline.-outputs$space_separated_list_of_outputs.
In this current version of the Analyser tool, the input must always be an URI. And since usually we have more than one input for each pipeline, the same can be zipped. If the input is not an URI already, we can create a shared link in dropbox, for instance, and use that URI.
Example
Here is an example:
./bin/ngs4cloud-analyser analyse -pipes ./pipelines/pipeline.pipes
             -ir ./ir/ir.json
             -input https://github.com/CFSAN-Biostatistics/snp-pipeline/archive/master.zip
             -outputs snp-pipeline-master/snppipeline/data/lambdaVirusInputs/snplist.txt
                      snp-pipeline-master/snppipeline/data/lambdaVirusInputs/snpma.fasta
This will analyse and process the file -pipes, store the IR in the file -ir, set the input and
outputs for -ir and -output.
To execute the pipeline on a simulated environment, see subsection . . .
Run the monitor¶
In this section, we describe how to run the monitor with the virtual image provided for testing, after setting up the virtual imagem, as explained before. In a cloud environment, the setting will be similar, with the corresponding credentials.
Open a terminal and execute monitor.jar, a message explaining all the commands the monitor can execute should appear. The application monitor is a regular Java application package as a JAR file. To run, open a terminal and execute the command monitor at the working directory.
This aplication has 3 commands:
launch, to lauch the execution of a pipeline. This command is followed with the filepath of a IR file (a file produced by the analyser tool.- This command returns an integer, which is the id of the launched pipeline.
status, to check the state of the pipeline execution. This command is followed by theÌDreturned by a execution of the previous commandoutputs, to download the outputs of a pipeline execution after it has finished. This command is followed by theÌDof the pipeline. Notice that this will only download the outputs that were previously specified by the analyser tool to be downloaded for this pipeline.
Example
Here is an example:
"java -jar monitor.jar launch ir.json"
The pipeline represented in the file ir.json, which in this example is assumed to be in the same directory as the monitor.jar, is launched for execution.
You will now see in the console messages regarding the upload of the input file.
Once the upload is finished a message like this will appear "ID: 1", this is the ID attributed to the launched pipeline.
To check the state of the pipeline execution type the following command:
"java -jar monitor.jar status 1"
notice that “1” is the id of pipeline, which was given in the previous step. If the pipeline has finished executing this message will appear
"The pipeline execution has finished with success."
When the pipeline execution has finished type the following commands to download its outputs:
"java -jar monitor.jar outputs 1 ."
This will download the outputs of the pipeline to the directory where the monitor is beeing executed.
Here is a video for demostrating the previous steps: